hpo economic commentary, 2nd quarter 2024
What impact has the trade war on export figures?
The most important facts
- The real order intake of German machinery manufacturers fell by 9 % in the first quarter compared to the same quarter of the previous year. The decline in demand affected almost all segments of machine builders. 19 out of 21 sub-categories of the sectors recorded a falling 12-month average in a year-on-year comparison. Overall, this value dropped by 12 % in the German machinery sector compared to the previous year.
- Over the last 20 years, Swiss machine builders have lost nominal market share to their German competitors. If the order intake of Swiss manufacturers is converted into EUR at exchange rates prevailing at the time, the trend in order intake in Switzerland is very similar to that in Germany.
- The Business Confidence Index (BCI) and Consumer Confidence Index (CCI) sentiment indicators published by the OECD continued to brighten but remained below the neutral mark of 100 points in the United States, Europe, and China and thus in contractionary territory.
- The trade war between the major economic powers, which has been smouldering since 2018, and the overall low economic growth are reflected in the German, Chinese, and United States trade figures: Imports have been falling significantly in all three countries since 2023, and the United States has been steadily losing weight in China’s export statistics since 2018.
Below you will find the detailed version of the hpo Economic Commentary from Q2 2024.
Share article

Order intake in mechanical engineering continues to fall
Inflation-adjusted incoming orders (quarterly value) for German mechanical engineering companies fell by 9 % year-on-year in the first quarter, according to data from the German statistics office Destatis. The downturn in the capital goods industry is continuing as expected. The 12-month moving average fell by 12 % within a year.
In the Destatis statistics, mechanical engineering is divided into 21 sub-categories, and incoming orders are published monthly for all categories. It is noticeable that the 12-month moving average declined year-on-year in 19 out of 21 categories, in most segments between 10 and 20 %. Only the two segments, “Manufacture of engines and turbines, except aircraft, vehicle and cycle engines” and “Manufacture of machinery for metallurgy,” recorded positive growth figures. The hardest hit category in terms of incoming orders was “Manufacture of machinery for paper and paperboard production,” where the 12-month moving average plummeted by 42 % year-on-year. This means that the weak demand in the German mechanical engineering sector is broad-based and encompasses almost all segments.
Quarterly figures have recently stabilised in particularly early-cycle sectors such as the textile machinery industry. However, in the late-cycle machine tool industry, for example, the decline in quarterly figures continues unabated. Contract customers can call up detailed data on this in the hpo cockpit.
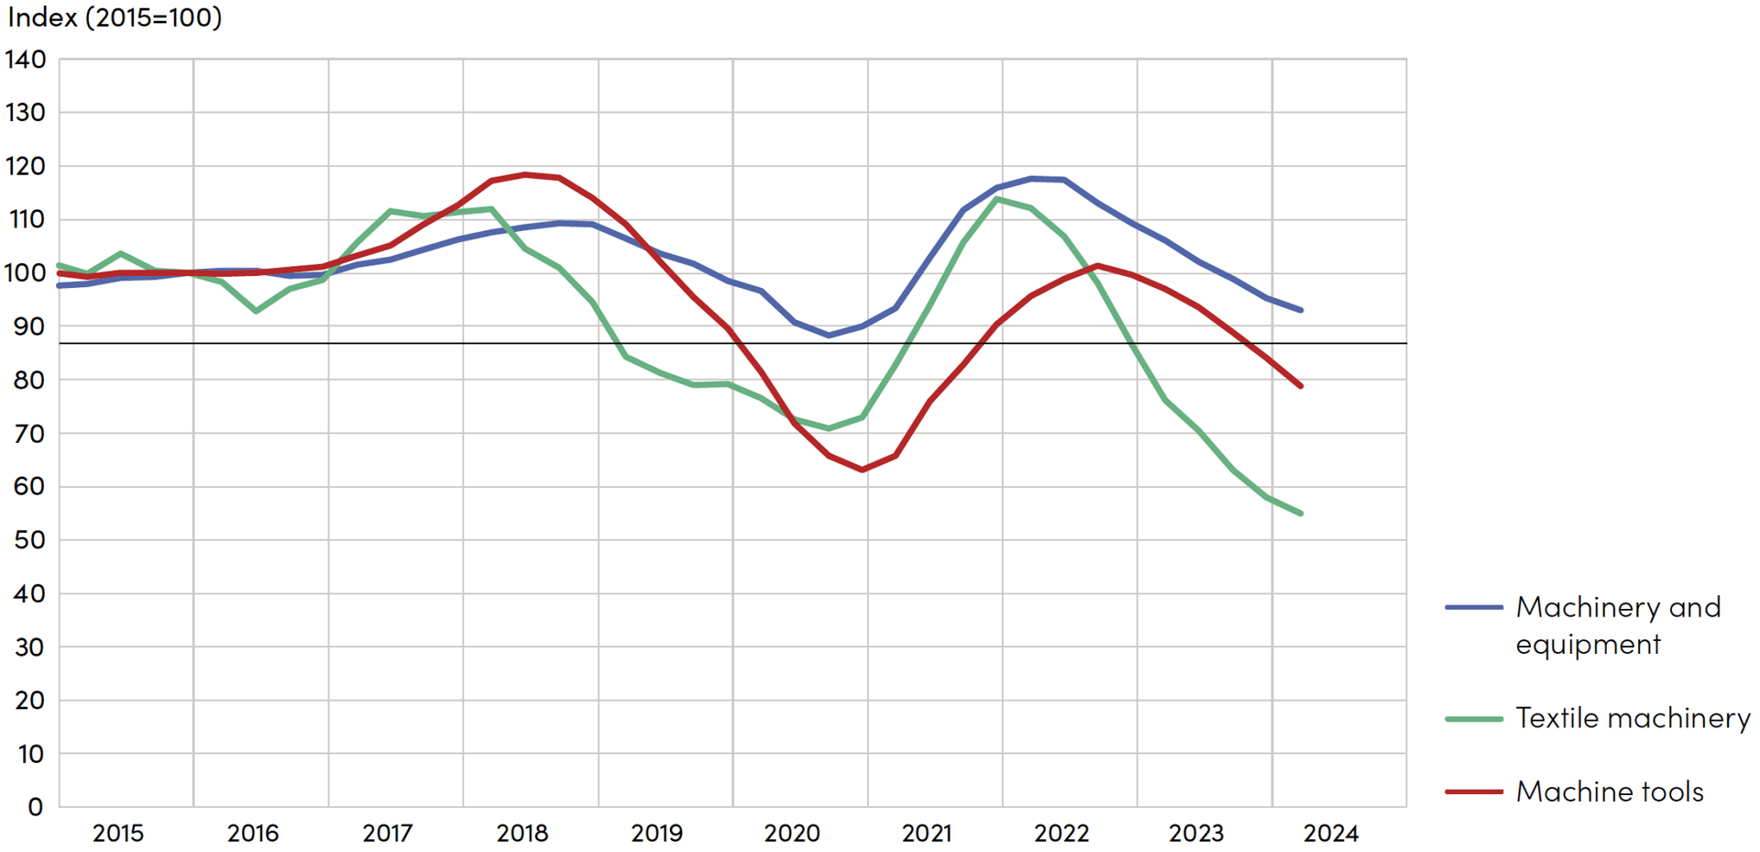
Fig. 1: Real order intake machinery and equipment, textile machinery and machine tools Germany, 12-month moving averages
Source: Raw data by Destatis, illustration by hpo forecasting
The development of demand among Swiss machinery manufacturers (here approximated with the order intake of the so-called MEM industries) is very comparable with that of their German competitors. If the nominal figures are compared in the respective national currencies (blue and red curves in fig. 2 on the next page), it appears that Swiss companies have been steadily losing market share since the financial crisis. However, if the order intake of Swiss mechanical engineering companies is converted into EUR at the respective exchange rates at the time (yellow curve), the development of demand in the two countries is very similar in a long-term comparison.
After the financial crisis, Swiss manufacturers lost some market share to their northern neighbours, but since the pandemic, they have largely made up for this shortfall and have even slightly surpassed it for over a year. Unsurprisingly, the same market forces are acting on machine manufacturers in both countries in this globalised market.
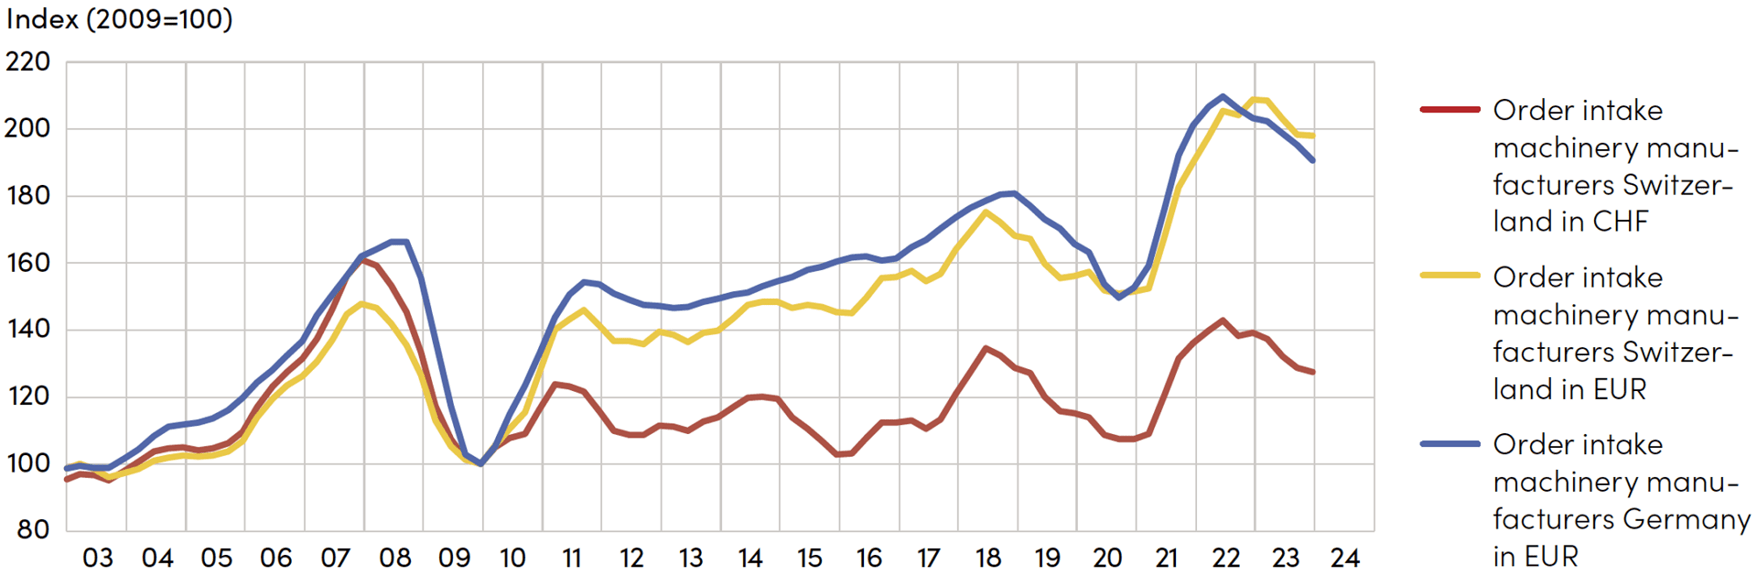
Fig. 2: Nominal order intake of machinery manufacturers in Switzerland (in CHF and in EUR at the respective exchange rates at the time) and Germany (in EUR), 12-month moving averages
Source: Raw data by Swissmem, VDMA, Federal Statistical Office, calculation and illustration by hpo forecasting
Sentiment indicators continue to brighten, but European company representatives in China are becoming more pessimistic
The Business Confidence Index (BCI) published by the OECD has been rising in many countries for several months and, in April, was only just in contractionary territory in Europe (99.6 points), the United States (99.1 points), and China (99.0 points). In Germany, however, the trend is still pointing downwards. The BCI is a good early indicator for the industry. The current momentum neither favours a further slump nor a rapid recovery in demand in the industry. There is a lack of clear orientation in the market.
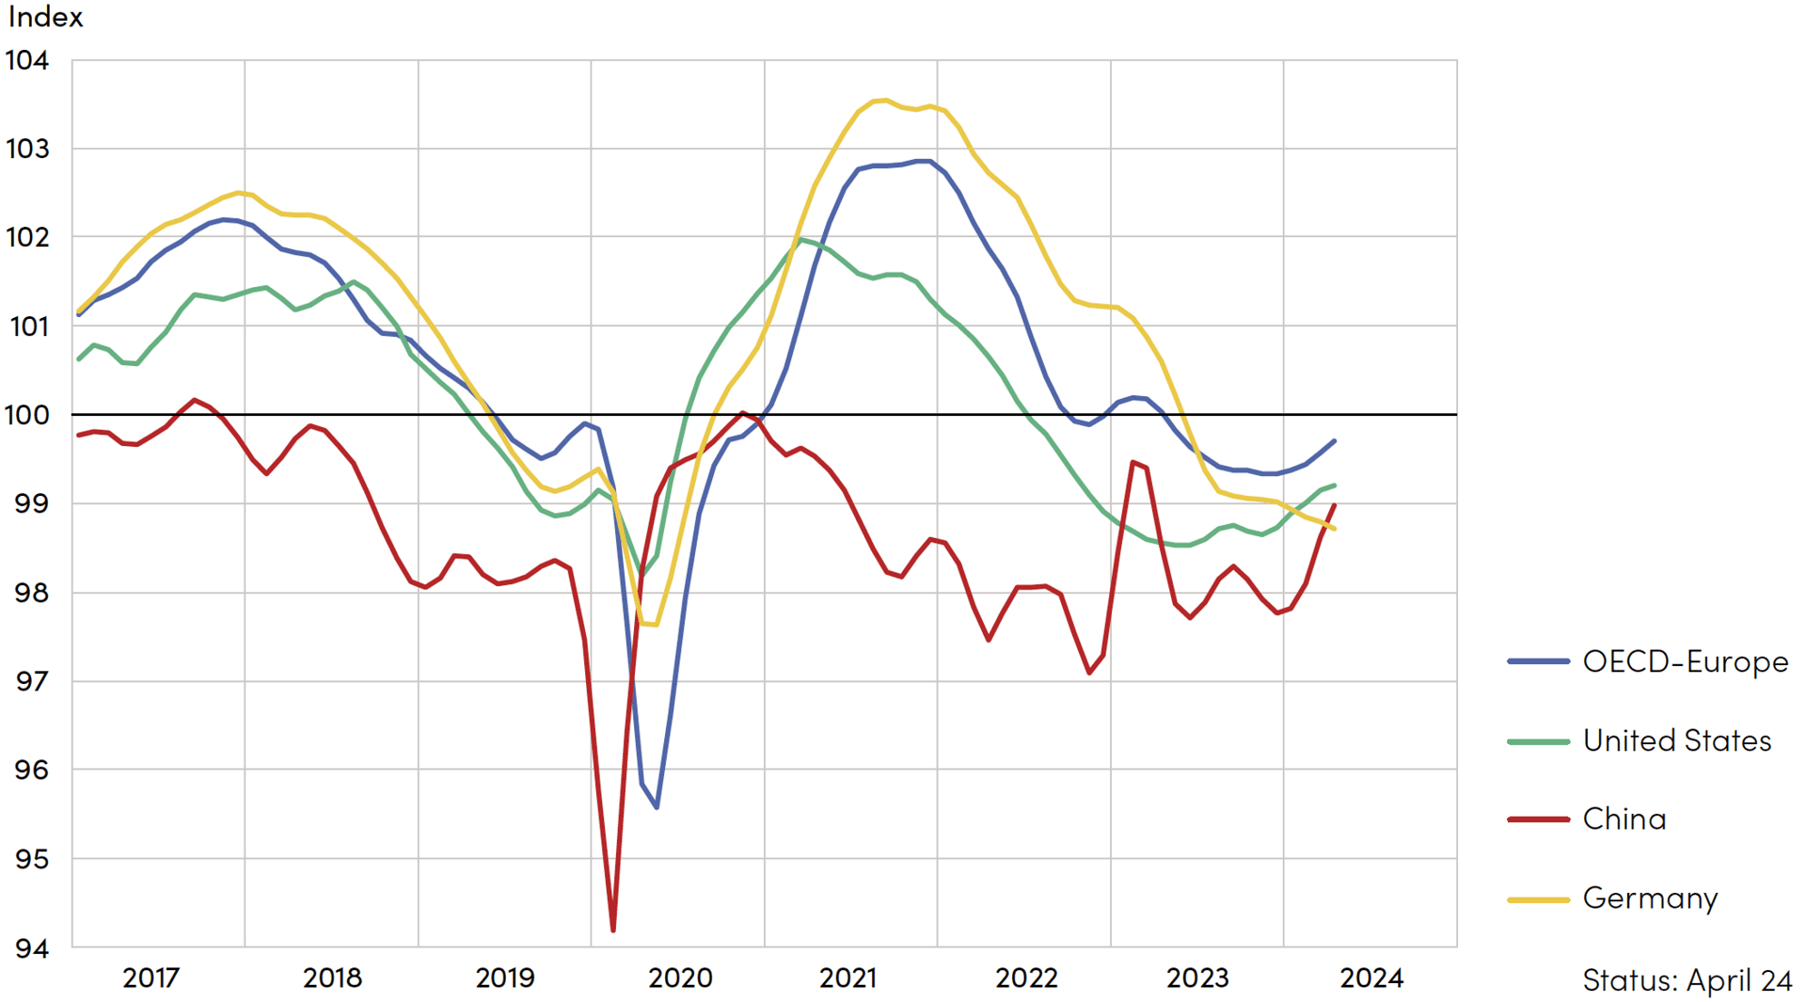
Fig. 3: Business Confidence Index (BCI) in Europe, Germany, the United States and China
Source: Raw data by OECD, illustration by hpo forecasting
An upward trend can be seen in consumer sentiment. In the United States and Europe, the Consumer Confidence Index (CCI) stood at around 99 index points in April. Despite an upward trend, however, the value in China remained very low at 94 index points, reflecting a high level of pessimism among consumers there.
The results of the latest Business Confidence Survey 2024 conducted by the European Chamber of Commerce in China paint a decidedly negative picture of the economic situation there. At the beginning of the year, the Chamber surveyed 259 European companies operating in China. Over two-thirds of the companies surveyed stated that doing business in China had become more difficult for them. This is the highest figure in the history of the survey. We have often discussed the reasons for this in our publications: low consumption, growing overcapacity, the persistent real estate crisis, and regulatory challenges.
55 % of the companies surveyed categorise the economic downturn as one of the three biggest challenges. 58 % report missed market opportunities due to market access and regulatory obstacles. As a result, 52 % of the companies surveyed are planning to cut costs, 26 % of them by reducing their workforce. Jens Eskelund, President of the Chamber of Commerce, warns of an impending negative spiral in China’s economy.
The only ray of hope is the increase in the proportion of respondents reporting market liberalisation in their sector (45 %, +9 percentage points compared to the previous year). Overall, however, the survey is a further indication that China is unlikely to return to strong economic growth in the coming years.
Industrial production and retail sales decline in the Euro zone
Economic growth has practically come to a standstill in the Euro zone. Year-on-year growth of 0.4 % was reported in the first quarter, after 0.1 % in each of the previous two quarters. Growth is currently coming primarily from the service sector. Both industrial production and retail sales have been on a downward trend for around a year. The relative stability of these indicators confirms the widespread theory that a deep recession can be avoided for the economy as a whole. For Europe, the indicators tend to point to a longer phase of weak growth, without a crisis but also without a boom.
In the United States, the economy grew by 3 % in the first quarter, almost as strongly as in the previous two quarters. The same applies to retail sales. Despite interventionist industrial policy, industrial production in the United States has been stagnating for around a year. The service sector is also the growth driver there. In April, the highly regarded ISM Services PMI fell below the growth threshold of 50 points for the second time since 2020. (The ISM Manufacturing PMI has been consistently below this mark since November 2022).
In China, official economic growth is sticking to the Communist Party’s target and grew by 5.3 % in the first quarter. Growth in industrial production was slightly lower in March at 4.5 %. Due to the strong growth in the same month last year, retail sales rose by a low 3.1 % in March by Chinese standards, but this figure is likely to recover in the summer when the challenging base effect from the previous year no longer applies. Despite various crises, the Chinese economy is growing, but the growth rate is still far below the average of the decades before the pandemic.
The United States is importing significantly fewer goods from China
In America, the election campaign is picking up speed, and both candidates, Biden and Trump, are outdoing each other with announcements about increasing import tariffs, particularly against China. President Biden’s latest move to implement drastic tariff increases on Chinese electric cars, semiconductors, solar cells, and several other products is just the latest round in the trade war launched by his opponent, Donald Trump, in 2018. China’s retaliation is unlikely to be long in coming.
The effects of the dispute are already evident in the trade data. American imports from China have grown continuously for decades, with brief setbacks in times of crisis, for example, during the financial crisis in 2009. After the first round of tariffs under President Trump in 2018, American imports from China fell continuously until the peak of the coronavirus crisis in mid-2020. This was followed by an explosion in American consumption, triggered by the United States’ immense stimulus measures and the change in private consumption patterns at the expense of services. As a result, the 12-month average of US imports reached a new high in autumn 2022 until President Biden announced far-reaching trade restrictions in the technology sector. American imports from China then plummeted by a quarter by January 2024 (measured by the 12-month moving average). American exports to China are at a much lower level and have also fallen less in the past.
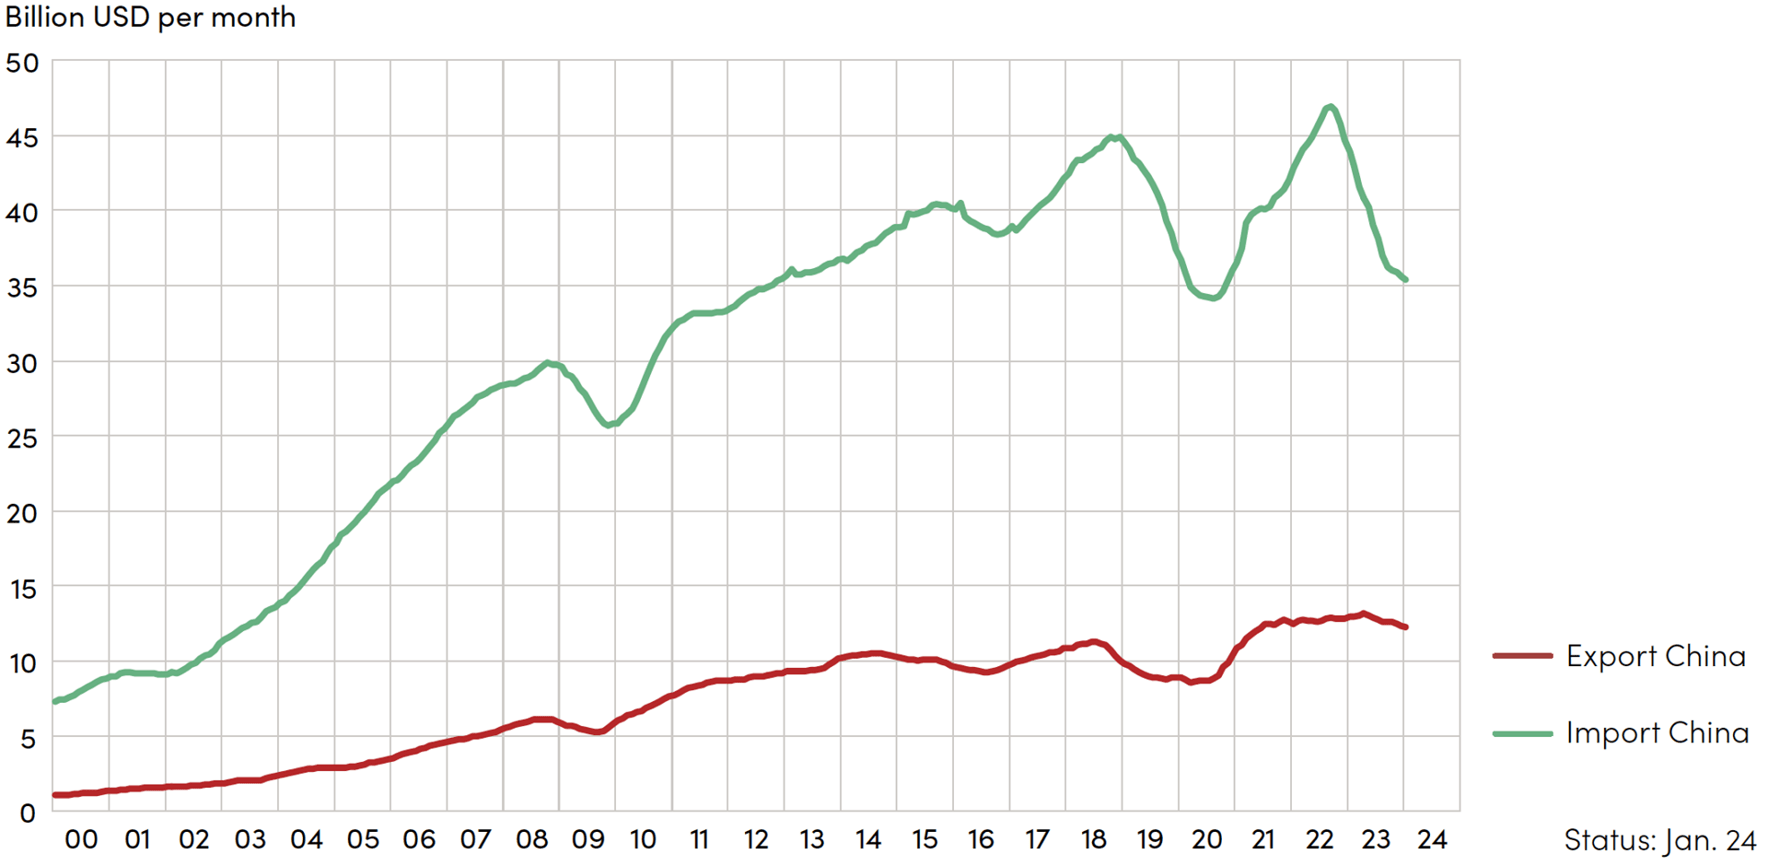
Fig. 4: Development of US imports from China and exports to China in USD billion per month, 12-month moving averages
Source: Raw data by IMF, illustration by hpo forecasting
In Europe, there are also voices in favour of raising trade barriers with China. However, German car manufacturers, for example, are much more dependent on the Chinese market than American companies. Europe is endeavouring to position itself between the two fronts without being crushed by them. How did German exports to China and the United States develop as a result?
At the beginning of 2021, Germany’s exports to both countries were almost identical, at around USD 10 billion per month each. Since then, the development has been diametrically different. While Germany’s exports to the United States rose by around 44 % between the beginning of 2021 and January 2024 (measured on a 12-month moving average), the corresponding figure for China fell by 5 %. This decline is likely to be primarily due to China’s phase of economic weakness. However, China is also increasingly substituting imported goods from Germany with domestic goods.
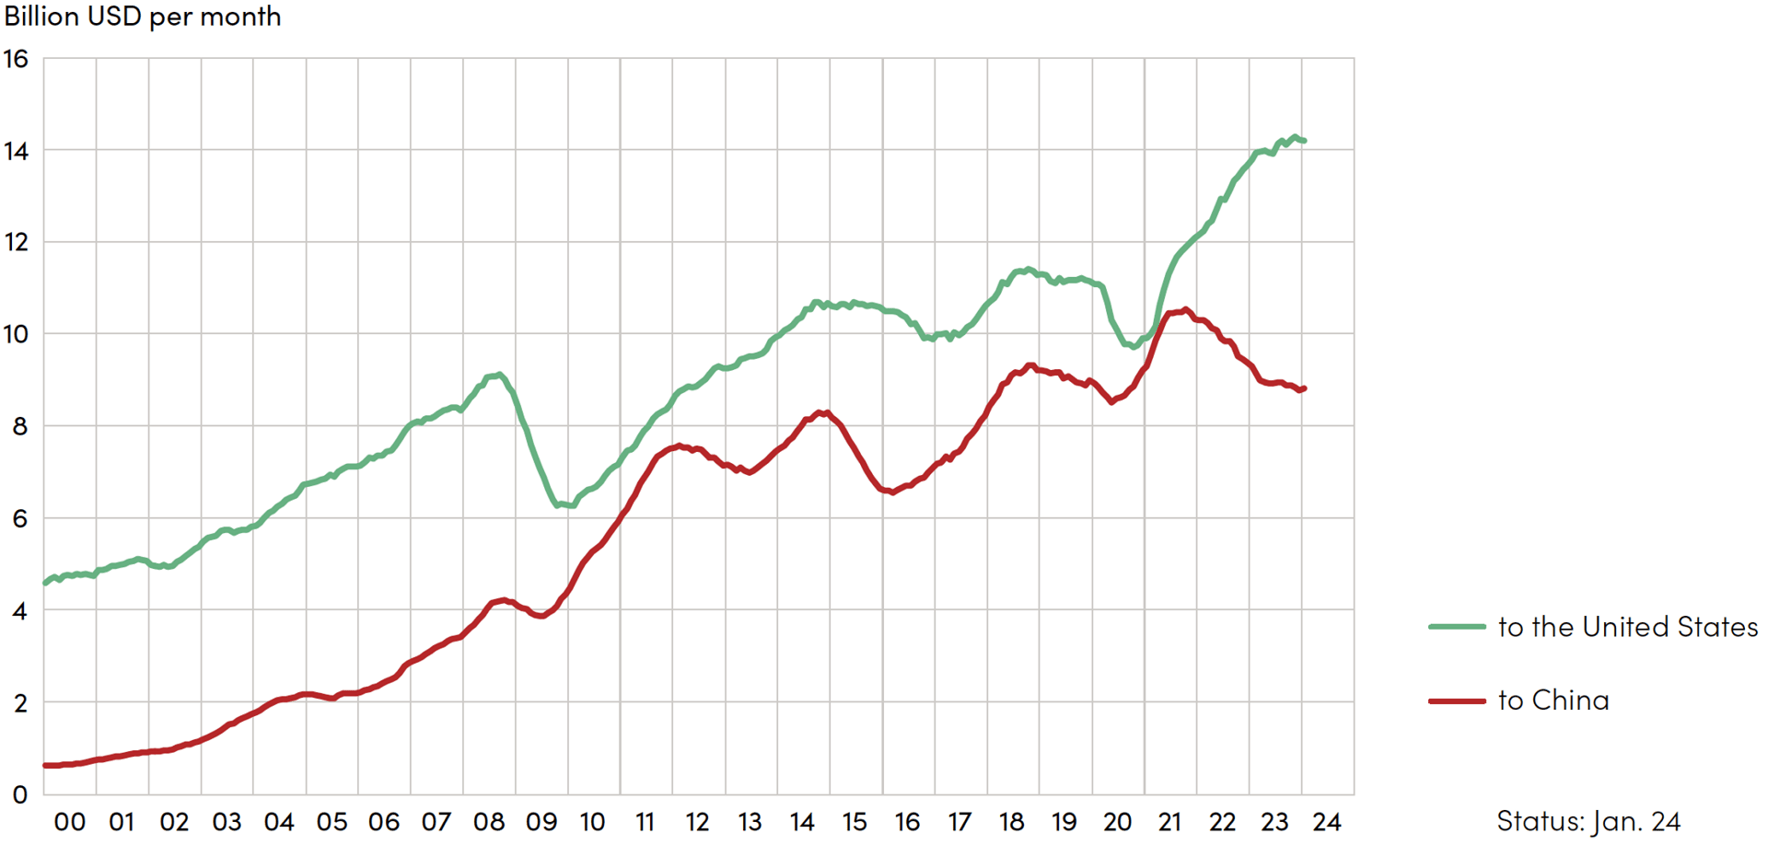
Fig. 5: Development of German exports to the United States and China, 12-month moving averages
Source: Raw data by IMF, illustration by hpo forecasting
When looking at Chinese exports, it is striking that exports to highly developed economies accounted for 65 % of the country’s total exports in March 2018. In January 2024, this figure was still 56 %. Accordingly, the share of Chinese exports to developing and emerging economies increased from 35 % to 44 %. This trend of the declining weight of highly developed economies in China’s export economy has been observed for some time. In 1992, only 13 % of all Chinese exports went to developing countries and emerging economies. However, the trend has accelerated again in recent years.
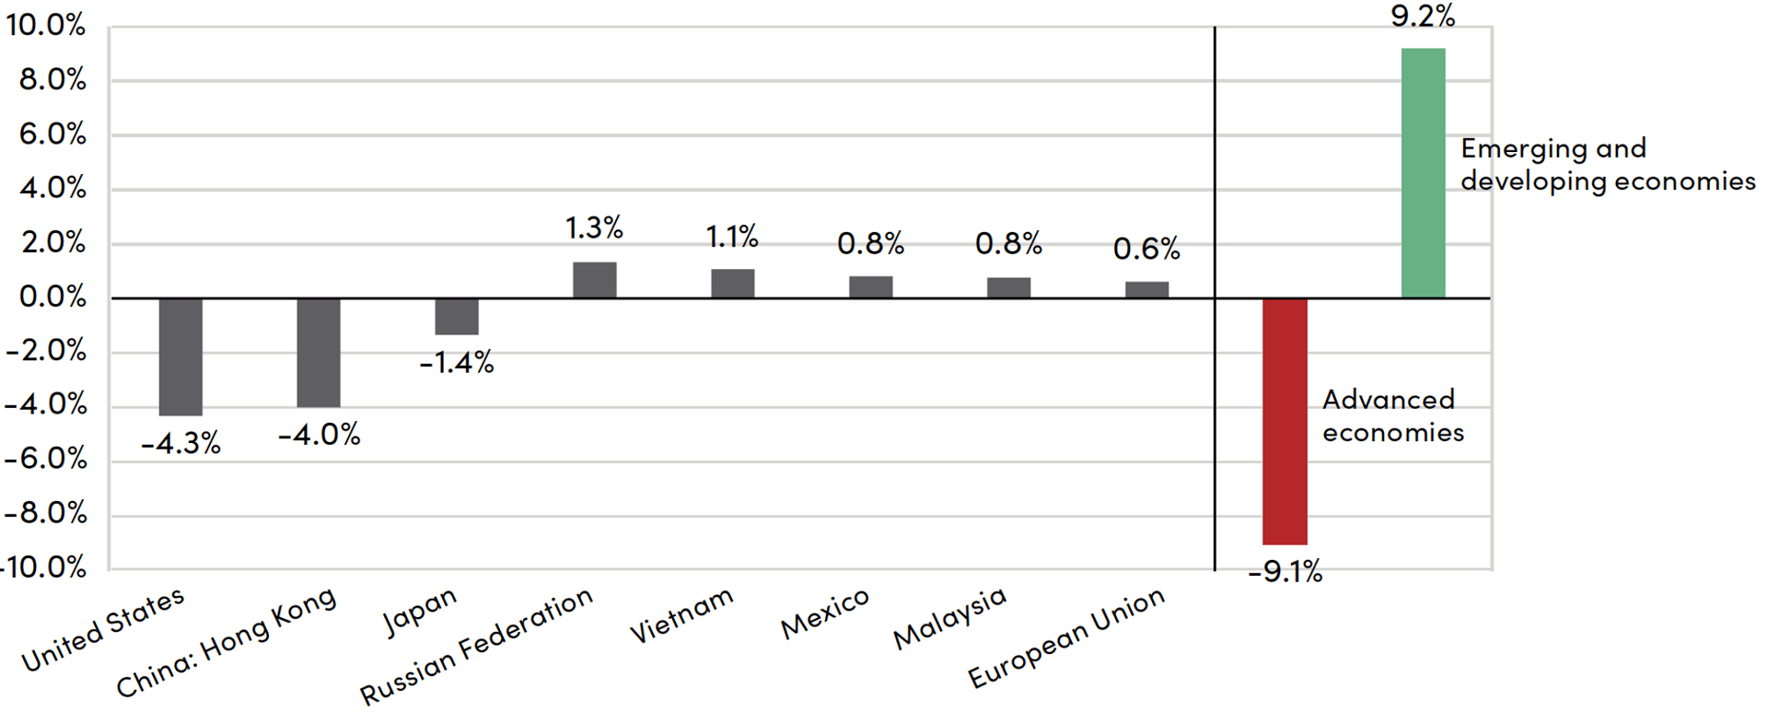
Fig. 6: Change in export share of Chinese exports by destination between March 2018 and January 2024 (measured by 12-month moving average)
Source: Raw data by IMF, calculation and illustration by hpo forecasting
In terms of exports, China benefited from very strong consumption in the West until 2023, and the United States was able to significantly increase its energy exports, particularly after the outbreak of the war in Ukraine. China and the United States have recently seen a decline in exports, while German exports continue to rise. However, the export boom in Germany was previously much less pronounced. Imports have been falling in all three countries since 2023, but the decline now appears to be levelling off.
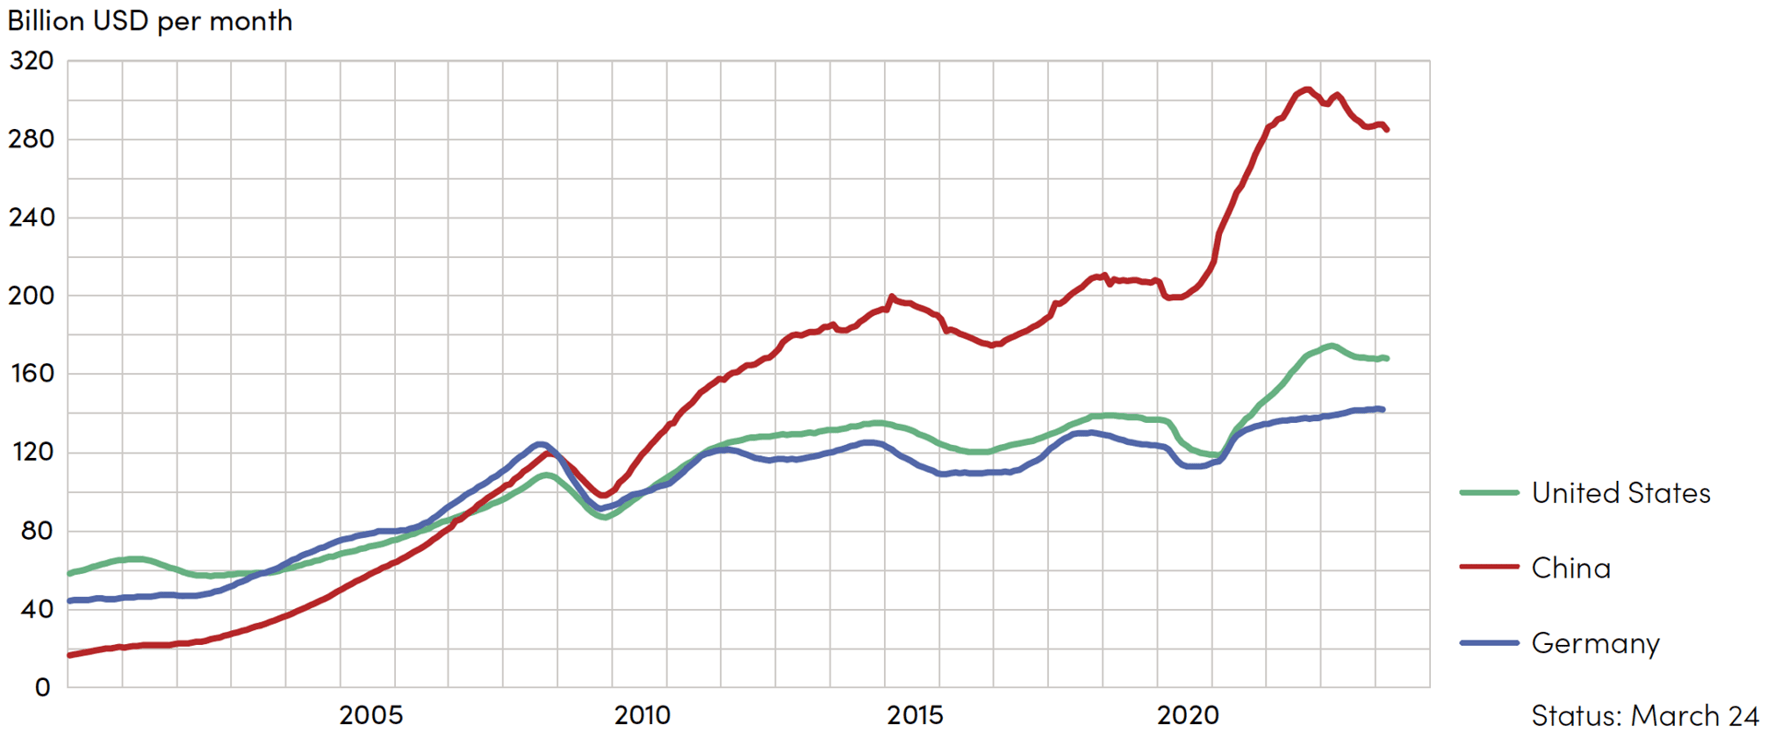
Fig. 7: Development of goods exports from China, Germany, and the United States to the world in USD billion per month, 12-month moving averages
Source: Raw data by IMF, illustration by hpo forecasting
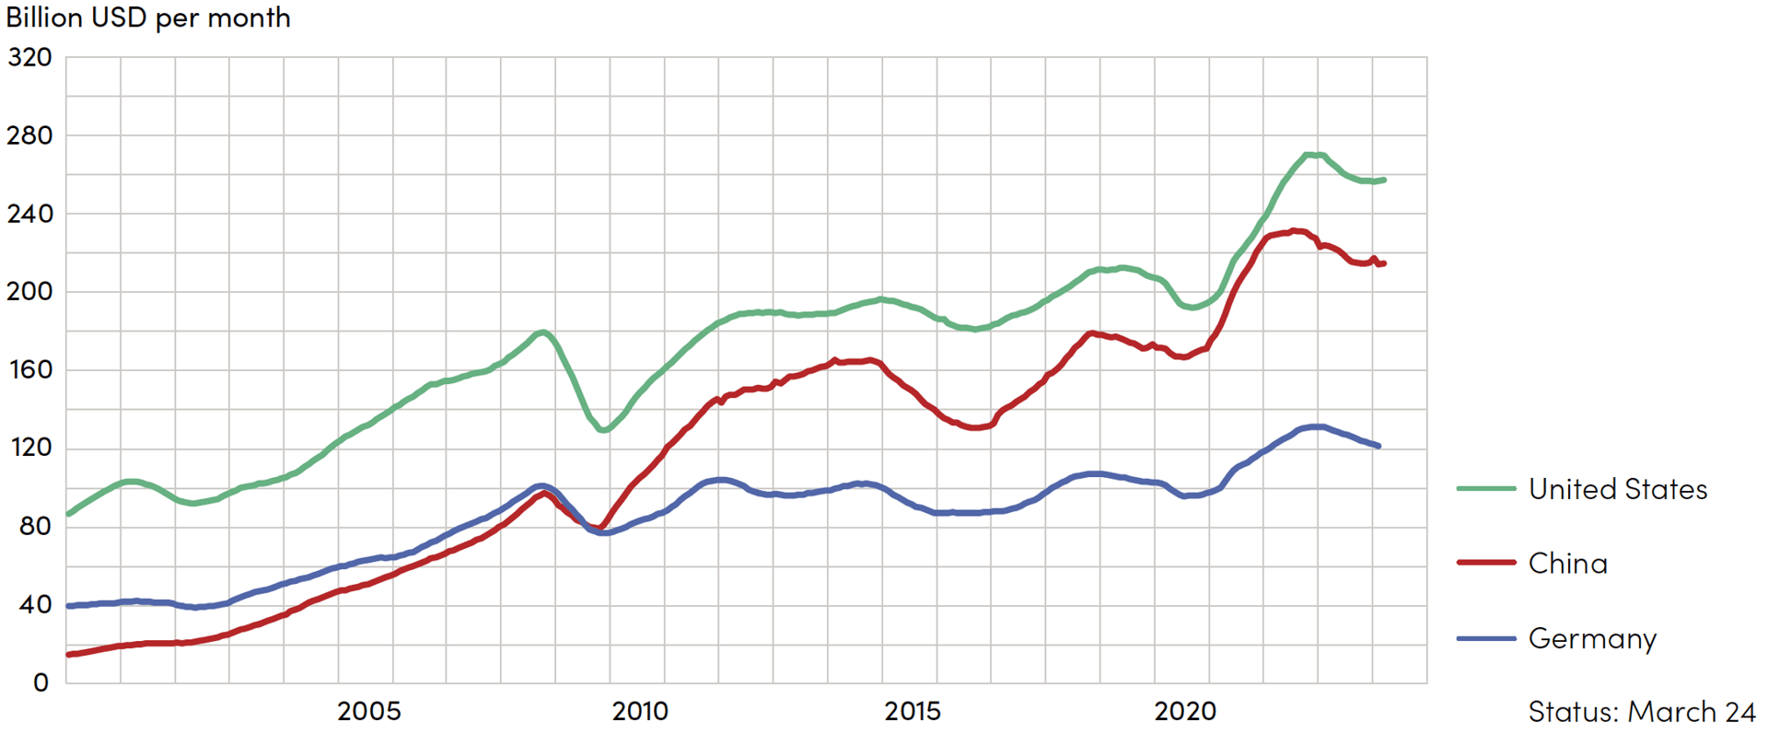
Fig. 8: Development of goods imports from China, Germany, and the United States to the world in USD billion per month, 12-month moving averages
Source: Raw data by IMF, illustration by hpo forecasting